The Unhandy Valley · system study
The graph stays in view.
This route starts from the original drawing. It does not reuse the Three.js studies or the synthetic essay curve.
Question Can one sticky figure explain the complete curve, its local maximum, its valley, and its recovery through ordinary scroll?
Scroll system · source trace
Can one graph accumulate the argument?
The graph stays near the top of the viewport only for this opening sequence. Native scroll pans and zooms the same traced figure.
- SO-101: source-sketch position 2 percent across the complexity axis and 22 percent up the usefulness axis.
- Sunday: source-sketch position 11 percent across the complexity axis and 41 percent up the usefulness axis.
- Atlas: source-sketch position 18 percent across the complexity axis and 31 percent up the usefulness axis.
- Psyonic: source-sketch position 27 percent across the complexity axis and 8 percent up the usefulness axis.
- 1X: source-sketch position 43 percent across the complexity axis and 26 percent up the usefulness axis.
- Sharpa: source-sketch position 52 percent across the complexity axis and 44 percent up the usefulness axis.
- human: source-sketch position 68 percent across the complexity axis and 69 percent up the usefulness axis.
- superhumanoid: source-sketch position 83 percent across the complexity axis and 88 percent up the usefulness axis.
Whole curve
One early peak. One deep valley. One long recovery.
The sketch makes one claim at a glance: more complexity does not produce more usefulness in a straight line.
Local maximum
Simple grippers peak early.
Two- and three-fingered grippers reach useful work with relatively little mechanism, control, or cost.
The valley
Human shape adds burden before it adds capability.
More parts, control problems, and failure modes can make a hand less useful before it gets close to the human hand.
Recovery
The climb out is much longer than the fall in.
The source sketch predicts that humanoid hands recover usefulness only after a large increase in capability and complexity.
Whole curve
The graph returns to the full argument.
The full view restores the original claim before the graph releases into its source record.
Trace provenance
The source stays available for comparison.
The SVG uses 29 curve samples and eight point centers from this 1800 × 1439 sketch. The clean axes remove camera skew and paper wobble. The curve and relative positions remain tied to the drawing.
Show original sketch
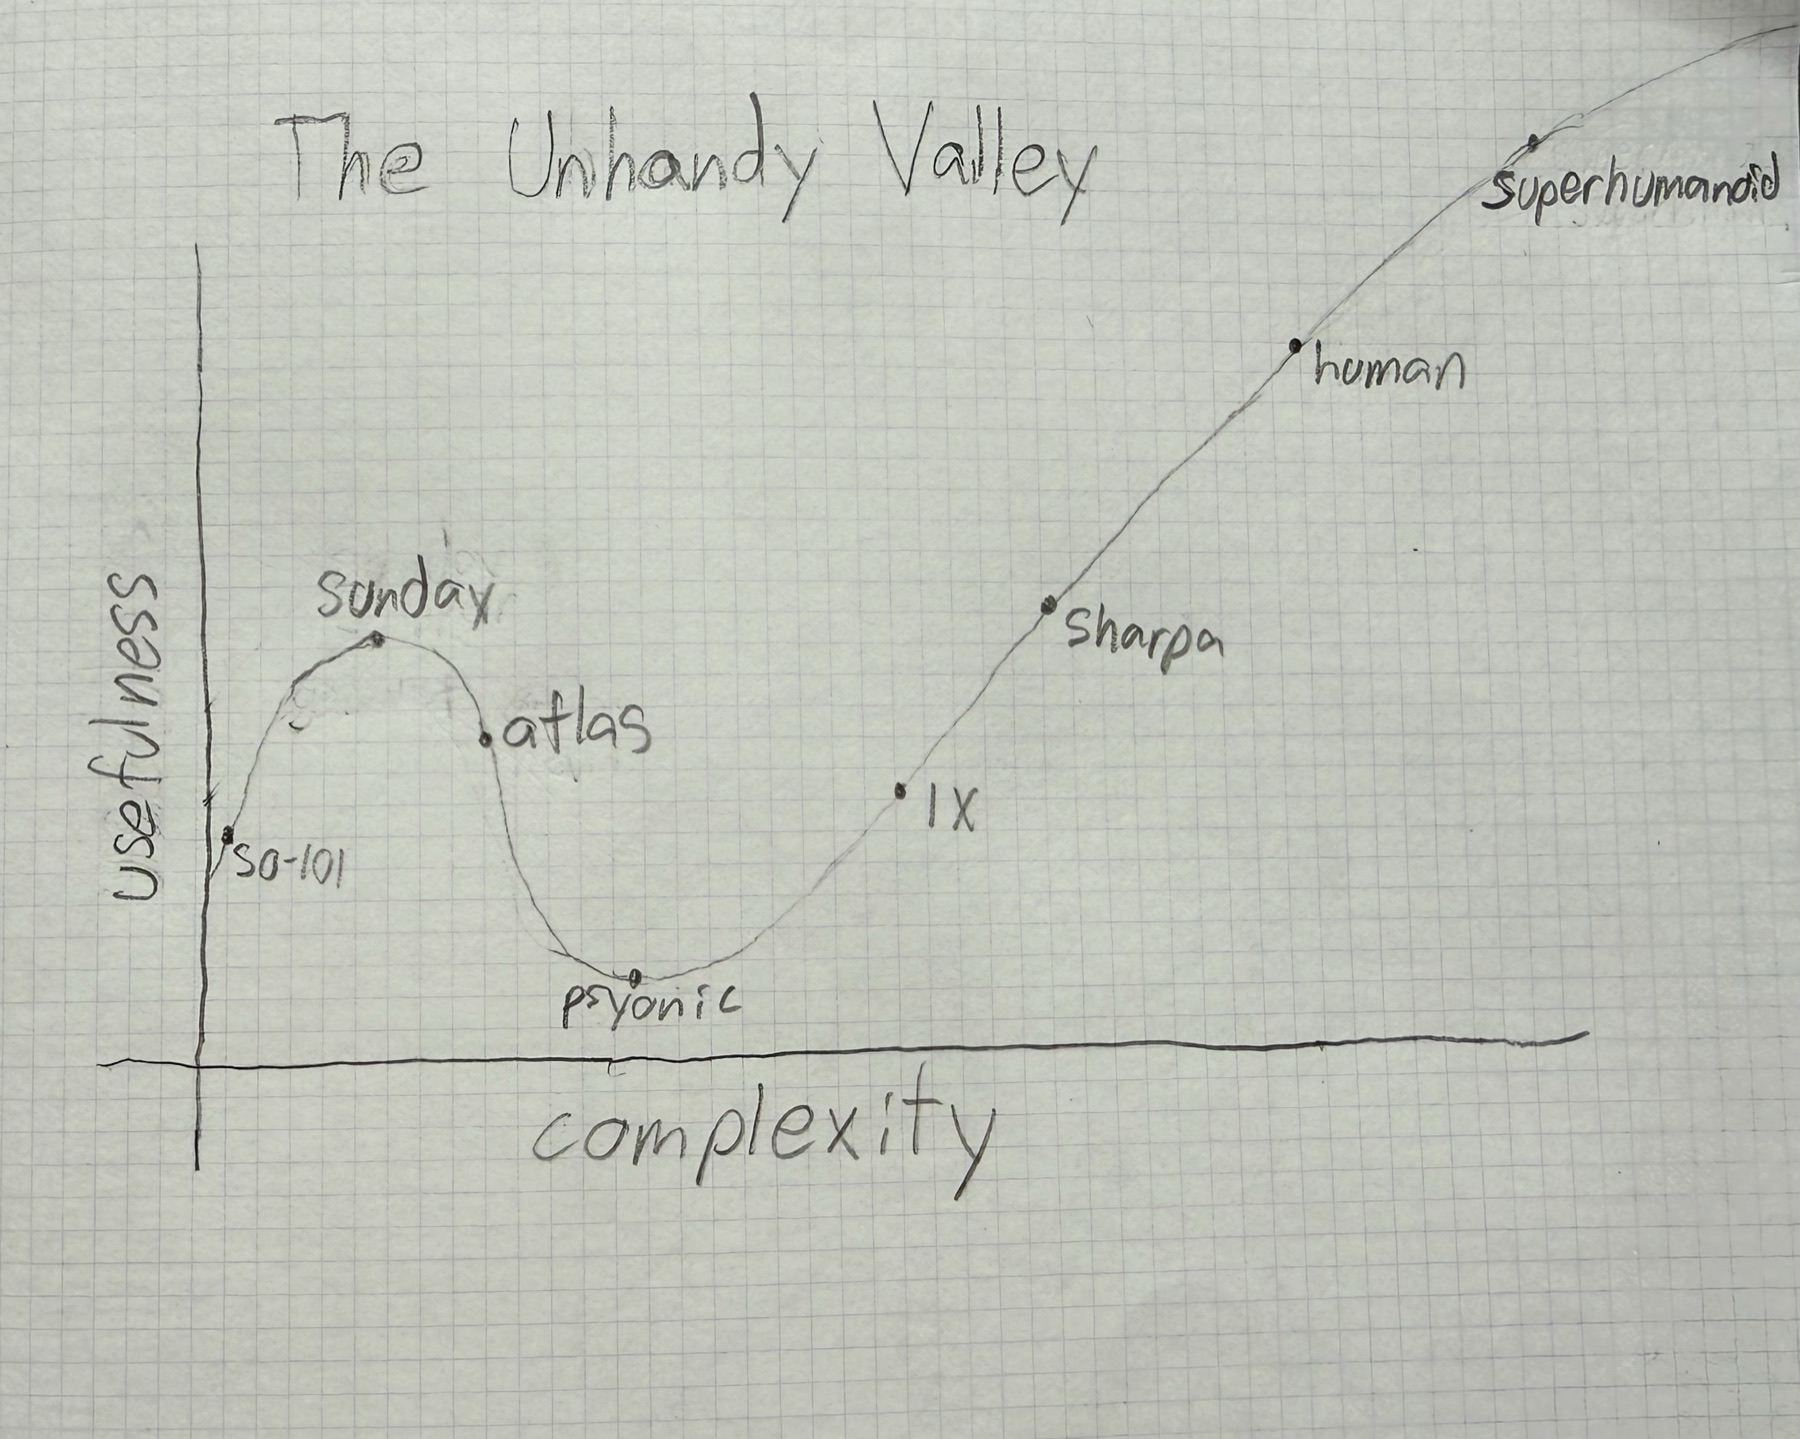
The labels “Sunday” and “Sharpa” are current readings of the handwriting and still need author confirmation.